
The Quality and Outcomes Framework (QOF) is a voluntary annual reward and incentive programme for all GP practices in England, detailing practice achievement results. It is not about performance management but resourcing and rewarding good practice.
The QOF contains five main components, known as domains. The five domains are: Clinical, Public Health, Public Health – Additional Services, Public Health – Vaccination and Immunisation and Quality Improvement. Each domain consists of a set of achievement measures, known as indicators, against which practices score points according to their level of achievement. The 2024-25 QOF measured achievement against 76 indicators; practices scored points based on achievement against each indicator, up to a maximum of 635 points.
- Clinical: consists of 59 indicators across 21 clinical areas (e.g. chronic kidney disease, heart failure, hypertension) worth up to a maximum of 401 points.
- Public health: consists of five indicators (worth up to 85 points) across three clinical areas – blood pressure 45+, obesity 18+ and smoking 15+.
- Public health – additional services: consists of two indicators (worth up to 11 points) across one service area – cervical screening.
- Public health – vaccination and immunisation: consists of four indicators (worth up to 64 points) across one service area - vaccination and immunisation
- Quality improvement: consists of six indicators (worth up to 74 points) across two areas – optimising demand and capacity in general practice and workforce and wellbeing.
For accessibility purposes, all conditions/measures within public health, public health additional services and public health vaccination and immunisation are to be found under the one heading ‘Public Health’.
The QOF gives an indication of the overall achievement of a practice through a points system. Practices aim to deliver high quality care across a range of areas for which they score points. The final payment is adjusted to take account of surgery workload, local demographics, and the prevalence of chronic conditions in the practice's local area.
NHS England has developed this online database to allow patients and the public easy access to the latest annual QOF data. NHS England is working to make information more relevant and accessible to patients and the public, regulators, health and social care professionals and policy makers, leading to improvements in knowledge and efficiency.
Browse the online database to find the results for your local surgery.
Other searches will compare your local GP practice to other GP practices in the local area and the national results across England, but caution should be taken in interpreting the results, as explained below in “what this site cannot tell you”.
The online database provides easy access to comprehensive information on the pattern of common chronic diseases such as asthma, diabetes and coronary heart disease. In terms of scale, the data for QOF is collected from 6,188 (97.6%) GP practices with approximately 63 million registered patients in England.
The QOF helps practices compare the delivery and quality of care currently provided against the achievements of previous years. Ultimately, the aim is to improve standards of care by assessing and benchmarking the quality-of-care patients receive.
Payment protection that had been applied to indicators in the years 2022-21 and 2021-22 in response to the COVID-19 pandemic. This was removed in 2022-23, reinstated in 2023-24 and 2024-25, details of this can be found in the Quality and Outcomes Framework guidance for 2024/25.
Additionally, the following changes to QOF indicators have been implemented in 2024-25:
- The total points available to practices (635) remains the same as last year. The ‘MAPPING_INDICATORS.csv’ file shows the points allocation for 2024-25.
- Within the Cholesterol indicator group CHOL001 has been replaced by CHOL003, and CHOL002 has been replaced by CHOL004
- For the 2024-25 reporting year, the depression disease register capturing all patients with an unresolved diagnosis of depression since 1 April 2006 has been reintroduced.
- The total points available to practices is 635 and all payments will be subject to prevalence and list size adjustments.
The implementation, subsequent removal and reintroduction of payment protection and the changes to QOF indicators should be considered when comparing 2024-25 QOF data with QOF data for previous years.
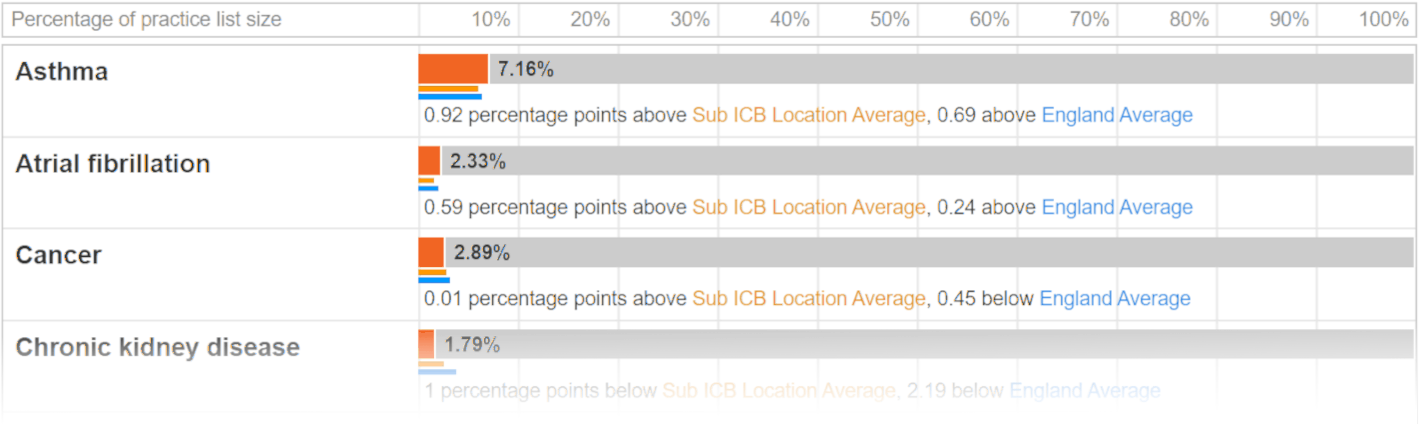
The sample of the output chart below shows the prevalence for some of the conditions for an individual GP practice.
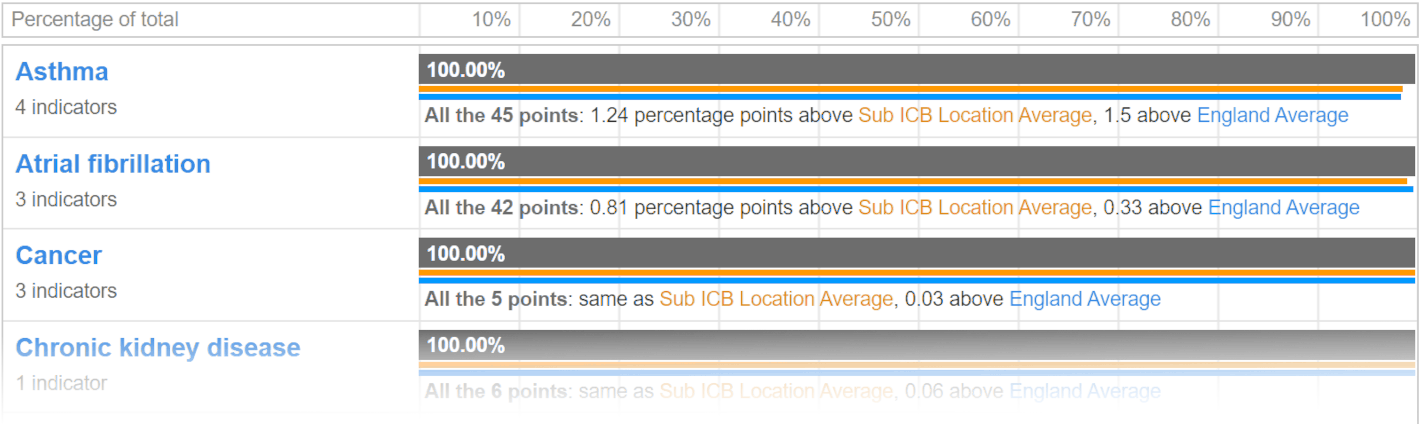
The sample of the output chart below shows the results for some of the clinical indicator groups for an individual GP practice.
The results for previous years are presented in the chart, which also displays the year's Sub Integrated Care Board Location (Sub ICB Location) and England averages.
Similar charts are available for the total achievement results, the individual domain results and the underlying achievement details for the individual indicators within each indicator group.
You can use this specially designed website to make specific searches on achievement for years prior to 2024-25 in the following ways:
- search for any GP practice in England
- find the overall achievement score for any practice
- breakdown the achievement by a series of clinical measures
- compare local practice achievement with other practices and the local Sub ICB Location and England averages
- find explanations of the QOF clinical indicators
- export simple data tables of multiple practice results
For the 2020-21 reporting year, this functionality is restricted to disease prevalence only.
- The QOF information is collected at an aggregate level for each practice and does not refer to specific patients, therefore it cannot show how well a practice treats its patients.
- The QOF only reflects part of the work that a practice is responsible for; it measures only those conditions specified by NICE and used in the 2024-25 GMS contract. As such NHS England does not recommend or endorse the use of QOF data to rank practices into league tables. Users should also bear in mind that a practice which has no patients who have a particular QOF-measured condition cannot score any QOF points for that clinical area and could wrongly be perceived as being a lower performer in any rank of points scored. This is particularly relevant for specialist centres and those with specific demographics, e.g. a university practice whose patients are primarily students.
- Participation in the QOF is voluntary – no data is available for those practices that do not choose to participate in the QOF.
The QOF FAQs are available on the QOF publication page:
digital.nhs.uk/data-and-information/publications/statistical/quality-and-outcomes-framework-achievement-prevalence-and-exceptions-data/2024-25/frequently-asked-questions