
Browse the online database to find the results for your local surgery.
Other searches will compare your local GP practice against other GP practices in the local area and the national results across England.
In terms of scale, the data for QOF are collected from 6,188 GP practices with approximately 63 million registered patients in England.
The QOF is a component of the GP contract, introduced in 2004. Achievement is measured for indicators in four areas, known as ‘domains’:
- Clinical: consists of 59 indicators across 21 clinical areas (e.g. chronic kidney disease, heart failure, hypertension) worth up to a maximum of 401 points.
- Public health: consists of five indicators (worth up to 85 points) across three clinical areas – blood pressure 45+, obesity 18+ and smoking 15+.
- Public health – additional services: consists of two indicators (worth up to 11 points) across one service area – cervical screening.
- Public health – vaccination and immunisation: consists of four indicators (worth up to 64 points) across one service area – vaccination and immunisation.
- Quality improvement: consists of six indicators (worth up to 74 points) across two areas – workforce and wellbeing and optimising demand and capacity in general practice.
For accessibility purposes, all conditions/measures within public health, public health additional services and public health vaccination and immunisation are to be found under the one heading ‘Public Health’.
By checking the options in the display panel, you can compare:
- practice prevalence against local Sub ICB Location average scores
- practice prevalence against England’s average score
- clinical achievement results for your practice against local Sub ICB Location or CCG average results (for years prior to 2021-22)
- clinical achievement results for your practice against England average results.
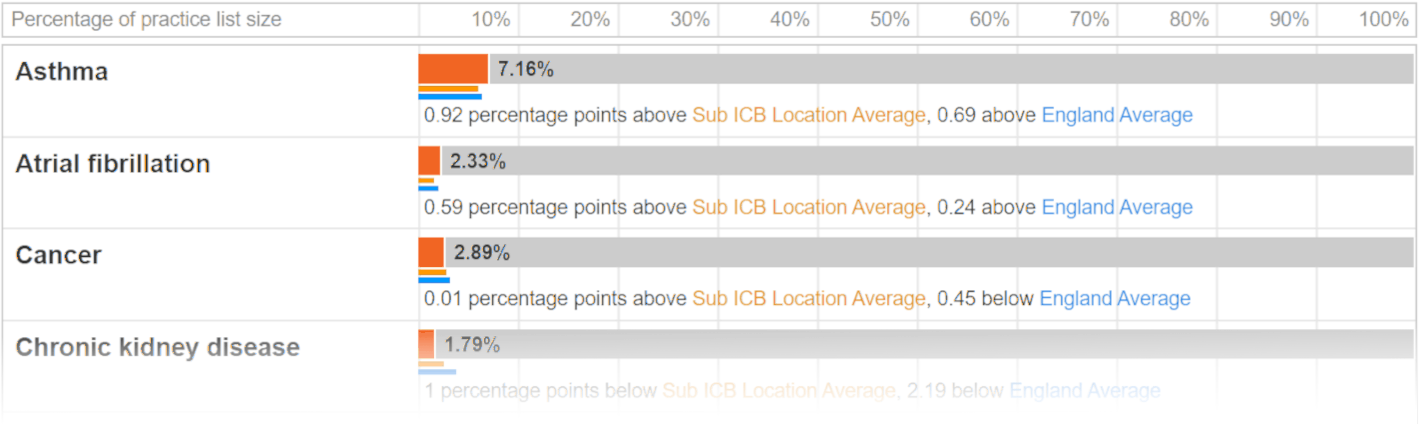
The sample of the output chart below shows the prevalence for some of the conditions for an individual GP practice.
Clinical prevalence is presented; this relates to the number of patients with a particular condition expressed as a percentage of the practice list size. QOF payments include prevalence adjustments, but these are not reflected in the publication of QOF data, which presents only raw prevalence figures.
The sample of the output chart below shows the results for some of the clinical indicator groups for an individual GP practice.
The results for previous years are presented in the chart, which also displays the year's Sub ICB Location and England averages.
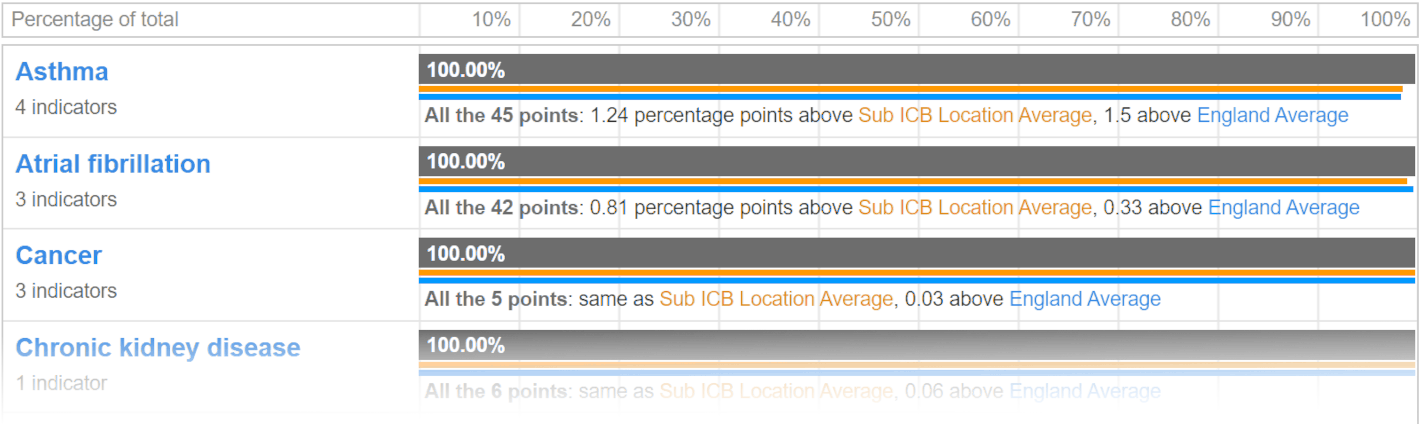
Similar charts are available for the total achievement results, the individual domain results and the underlying achievement details for the individual indicators within each indicator group.